reference — in the room
Latency numbers
in short — written for this site
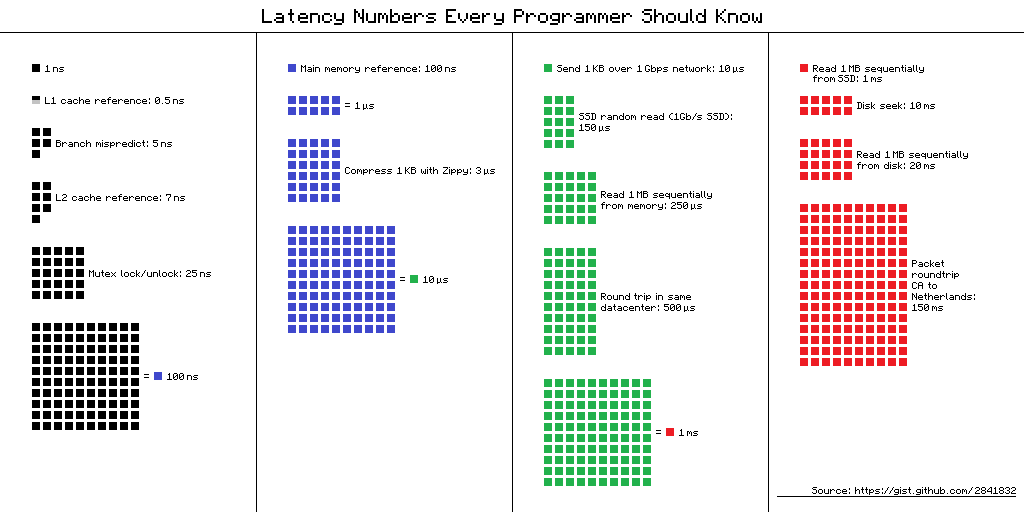
Each step is roughly ten times the last. This is why memory beats disk and why the round trip is the enemy.
from the primer — full sectionsynced
Latency Comparison Numbers
--------------------------
L1 cache reference                           0.5 ns
Branch mispredict                            5   ns
L2 cache reference                           7   ns                      14x L1 cache
Mutex lock/unlock                           25   ns
Main memory reference                      100   ns                      20x L2 cache, 200x L1 cache
Compress 1K bytes with Zippy            10,000   ns       10 us
Send 1 KB bytes over 1 Gbps network     10,000   ns       10 us
Read 4 KB randomly from SSD*           150,000   ns      150 us          ~1GB/sec SSD
Read 1 MB sequentially from memory     250,000   ns      250 us
Round trip within same datacenter      500,000   ns      500 us
Read 1 MB sequentially from SSD*     1,000,000   ns    1,000 us    1 ms  ~1GB/sec SSD, 4X memory
HDD seek                            10,000,000   ns   10,000 us   10 ms  20x datacenter roundtrip
Read 1 MB sequentially from 1 Gbps  10,000,000   ns   10,000 us   10 ms  40x memory, 10X SSD
Read 1 MB sequentially from HDD     30,000,000   ns   30,000 us   30 ms 120x memory, 30X SSD
Send packet CA->Netherlands->CA    150,000,000   ns  150,000 us  150 ms

Notes
-----
1 ns = 10^-9 seconds
1 us = 10^-6 seconds = 1,000 ns
1 ms = 10^-3 seconds = 1,000 us = 1,000,000 ns
Handy metrics based on numbers above:
- Read sequentially from HDD at 30 MB/s
- Read sequentially from 1 Gbps Ethernet at 100 MB/s
- Read sequentially from SSD at 1 GB/s
- Read sequentially from main memory at 4 GB/s
- 6-7 world-wide round trips per second
- 2,000 round trips per second within a data center
Latency numbers visualized
Source(s) and further reading
sourcedonnemartin/system-design-primer / README.mdanchor#latency-numbers-every-programmer-should-knowsyncedsynced from donnemartin/system-design-primer@master · 2026-08-17